この記事のコードをJupyter notebook形式で見るにはこちら。
リーマンの明示公式を構成する\(J(x)\)関数の第1項を簡素化した次の式を使ってゼータの非自明零点を足し合わせると、素数のピークが現れること、この式がvon Mangoldt関数と呼ばれるある数論的関数と密接な関係があることを説明しました。
これと全く双対な現象が知られています。von Mangoldt関数をある方法でフーリエ変換(メリン変換)するとゼータの非自明零点が周波数領域のピークとなって現れる、と言う現象です。あとで計算で使うので以下の変数scaleを定義しておきます。
(%i1) scale:1000000;
$$ \tag{${\it \%o}_{1}$}1000000 $$
では早速、von Mangoldt関数を定義します。nを自然数とします。
(%i2) mangoldt(n)='if n=1 then 1 elseif n=p^k then log(p) else 0;
$$ \tag{${\it \%o}_{2}$}{\it mangoldt}\left(n\right)=\left(\mathbf{if}\;n=1\;\mathbf{then}\;1\;\mathbf{elseif}\;n=p^{k}\;\mathbf{then}\;\log p\;\mathbf{else}\;0\right) $$
いつ見ても不思議な定義です。引数のnが1なら関数の値は1, nが素数pの冪乗p^kに等しい場合は関数の値はlog(p)、それ以外の引数に対しては関数の値は0です。kが無視されているし、乗法的でもない不思議な数論的関数です。
Maximaで実装するにあたり、nが素数pの冪乗かどうかをifactors(n)の結果のリストの長さが1であることで判断することにしました。以下がコードになります。
(%i3) mangoldt_c(n):=if floor(n)<2 then 0
else block([ifc:ifactors(floor(n))],if length(ifc)=1 then
log(ifc[1][1])
else 0)$
引数が数でない場合には関数を評価せず、そのままにしておきます。これで一種の遅延評価ができます。
(%i4) (matchdeclare(n,numberp),tellsimp(mangoldt(n),mangoldt_c(n)))$
von Mangoldt関数の総和をpsi(x)として定義します。
(%i5) 'psi(x)=sum(mangoldt(n),n,1,floor(x));
$$ \tag{${\it \%o}_{5}$}{\it psi}\left(x\right)=\sum_{n=1}^{\left \lfloor x \right \rfloor}{{\it mangoldt}\left(n\right)} $$
Maximaで(%o5)のように総和を使って定義すると同じ計算を何度もすることになり非常に遅いです。そこで配列型関数を使って一度計算したpsi(x)をキャッシュするようにします。そしてpsi(x)を最初に必要な分計算してしまいます。
(%i6) kill(psi_c)$
(%i7) psi_c[n]:=if n=1 then float(mangoldt(1)) else psi_c[n-1]+float(mangoldt(n))$
(%i8) psi(x):=psi_c[floor(x)]$
(%i9) for i:1 thru scale do psi(i)$
以下の(%o10)がpsi(x)のフーリエ変換の定義です。
(%i10) 'integrate( ('psi(x)-x)*x^(-1/2+%i*t),x,0,'scale);
$$ \tag{${\it \%o}_{10}$}\int_{0}^{ {\it scale} }{x^{i\,t-\frac{1}{2}}\,\left( {\it psi}\left(x\right)-x\right)\;dx} $$
これをMaximaで実装していきます。
ここでちょっと特殊なことをしています。psi(x)を0からscale=1000000まで変化させてそのフーリエ変換を求めるのですが、x=0付近は詳しく、x=scale付近は飛び飛びになるように調整しています(%i11の2行目のxlistの定義)。またpsilistにpsi(x)-xが計算されています(%i11の4行目)。
(%i11) xres:0.002$
xlist:exp(makelist(i,i,0,float(log(scale)),xres))$
tmax:60$
tres:0.1$
psilist: map(psi,xlist)-xlist$
innerproduct(list1, list2)は同じ長さのリストを取り、各要素の積和を計算します。
(%i16) innerproduct(list1,list2):=
if not(length(list1)=length(list2)) then
error("length of arg1 and arg2 does not match.")
else block([c:length(list1),total:0,t1,t2],
for i:1 thru c do (t1:pop(list1),t2:pop(list2),total:total+t1*t2),
return(total))$
\(imagpart(x^{-\frac{1}{2}+{\it i\,t} } )\)を計算してxxlistに格納します。
(%i17) xxlist(t):=imagpart(xlist^(-0.5+%i*t))$
各tについてxxlistとpsilistのinnerproductを計算する関数primepeek()を定義します。
(%i18) primepeek():=block([res:[ ],c:0],
for t:0 step tres thru tmax do (
if mod(c,100)=0 then print(t), c:c+1,
res:append(res,[innerproduct(xxlist(t),psilist)])),
return(res))$
(%i19) compile(all);
$$ \tag{${\it \%o}_{19}$}\left[ {\it mangoldt\_c} , \psi , {\it innerproduct} , {\it xxlist} , {\it primepeek} \right] $$
では計算してプロットしてみましょう。
(%i20) errlist:primepeek()$
(%i21) plot2d([discrete,makelist(i*tres,i,0,length(errlist)-1),errlist/length(xlist)]);

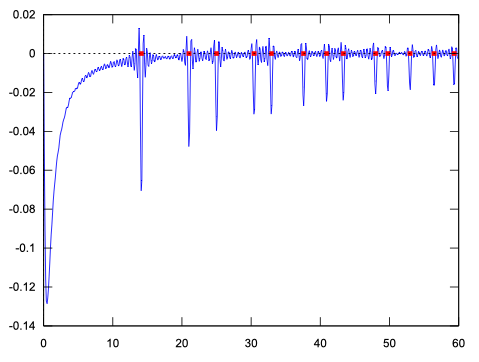
このグラフでは下向きのピークの位置が重要です。分かりやすくしてみましょう。
(%i22) /*
The LMFDB Collaboration, The L-functions and Modular Forms Database,
home page of the Zeros of zeta(s),
https://www.lmfdb.org/zeros/zeta/?limit=200&N=1, 2020 , [Online; accessed 10 October 2020].
*/
img_rho:[
14.1347251417346937904572519835625,
21.0220396387715549926284795938969,
25.0108575801456887632137909925628,
30.4248761258595132103118975305840,
32.9350615877391896906623689640747,
37.5861781588256712572177634807053,
40.9187190121474951873981269146334,
43.3270732809149995194961221654068,
48.0051508811671597279424727494277,
49.7738324776723021819167846785638,
52.9703214777144606441472966088808,
56.4462476970633948043677594767060,
59.3470440026023530796536486749922
]$
/* The rest 187 zeros are omitted as we draw graph up to 1/2+60*%i. */
先ほどのグラフにゼータの非自明零点の虚数部を小さい方から順にx軸上にプロットしてみます。赤い点がゼータの非自明零点の虚数部です。
(%i23) plot2d([[discrete,makelist(i*tres,i,0,length(errlist)-1),errlist/length(xlist)],[discrete,makelist([img_rho[i],0],i,1,13)]],
[style,[lines],[points,1]],[legend,false]);

完全に重なっています!von Mangoldt関数のフーリエ変換はゼータ関数の非自明零点の位置をよく知っている、と言うことがわかります。
von Mangoldt関数恐るべし、です。ゼータの非自明零点をうまく足し合わせるとvon Mangoldt関数が現れます。さらにフーリエ変換すると非自明零点に戻ります。
素数好き、ゼータ好きな人はみなvon Mangoldt関数も好きになるのだと思います。
この記事は、以前に書いた記事:
の焼き直しです。プログラムの骨格は同じですが、今回のものの方が少しだけわかりやすいかもしれません。文献[3]の回答欄にMathematicaでこのグラフを描くコードが掲載されており、今回のコードはそれをMaximaに移植したものです。
文献[3]はCC BY-SA with attribution requiredのライセンスで公開されているため、本記事のコードも同じライセンスを適用します。
以下は参考にした文献です。
[1] Wikipedia von Mangoldt function, https://en.wikipedia.org/wiki/Von_Mangoldt_function
[2] Conrey, The Riemann Hypothesis https://www.ams.org/notices/200303/fea-conrey-web.pdf
[3] https://stackoverflow.com/questions/8934125/how-plot-the-riemann-zeta-zero-spectrum-with-the-fourier-transform-in-mathematic/8975710#8975710, answer by Heike
[4] The LMFDB Collaboration, The L-functions and Modular Forms Database, home page of the Zeros of zeta(s), https://www.lmfdb.org/zeros/zeta/?limit=200&N=1, 2020 , [Online; accessed 10 October 2020].